
COMPARATIVE OUTCOME ANALYSIS OF CHILDREN WITH VESICOURETERAL REFLUX DIAGNOSED DURING WORKUP FOR PRENATAL HYDRONEPHROSIS VERSUS POSTNATAL URINARY TRACT INFECTION
Mandy Rickard, MN-NP1, Armando J. Lorenzo, MD2, Rahul Chanchlani, MD3, Caroline Munoz, BSc Student4, Natasha Brownrigg, MN-NP1, Kizanee Jegatheeswaran, BSc3, Jorge DeMaria, MD3, Luis H. Braga, MD3.
1McMaster Children's Hospital, Hamilton, ON, Canada, 2University of Toronto/ The Hospital for Sick Children, Toronto, ON, Canada, 3McMaster University, Hamilton, ON, Canada, 4Clinical Urology Research Enterprise (CURE) Program, McMaster Children's Hospital, Hamilton, ON, Canada.
INTRODUCTION:
Traditionally, patients with asymptomatic vesicoureteral reflux (aVUR) detected during the work-up of prenatal hydronephrosis (P-HN) are predominantly males with high-grade disease. Due to practice pattern changes regarding voiding cystourethrogram (VCUG) indications for P-HN over the past decade, fewer patients are being investigated, which may have altered the characteristics of this population. Therefore, we sought to compare our aVUR cohort to VUR children who presented after a urinary tract infection (UTI-VUR) in regards to clinical characteristics and outcomes.
Methods
We reviewed our prospectively collected primary VUR database of children 0-18 years from 2008-16 (n=171). We divided patients into 2 groups: aVUR and UTI-VUR. We collected the following variables: age at presentation, gender, VUR and HN grades, UTI and surgery rates. VUR and HN grades were categorized into VUR low(1-2) and high(3-5); non-dilating(1-2) and dilating(3-5); and Society for Fetal Urology (SFU) HN none, low(I/II) and high(III/IV) [based on the most dilated renal unit]. Patients’ characteristics and outcomes were compared between groups using parametric and non-parametric tests. Kaplan Maier curves were created for time to UTI and time to surgery analyses.
Results
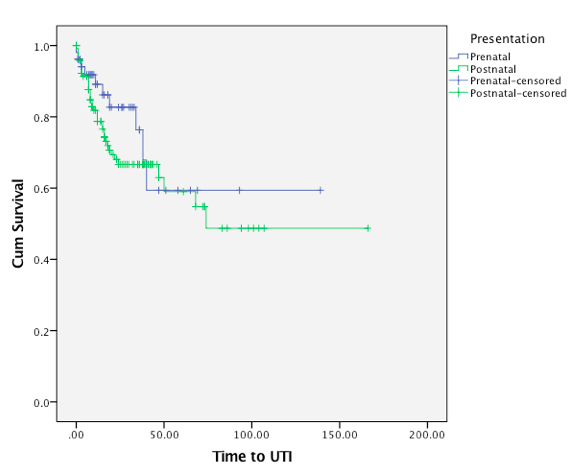
Of 171 patients, 52 (30%) had aVUR and 119 (70%) UTI-VUR. The median age at presentation was 2.5 (IQR 4) vs. 5 (IQR 7) months for aVUR and UTI-VUR groups (p<0.01), and mean follow-up time was 27+26 and 35+27 months, respectively (p=0.07). Males comprised 64% of the aVUR cohort compared to 43% in the UTI-VUR group (p<0.01). 36/52(62%) patients in the aVUR group had high grade reflux vs. 62/119 (40%) UTI-VUR children (p=0.04). The majority of patients in both groups were prescribed CAP (98% and 91%) respectively, (p=0.12) for a mean duration of 19+11 vs. 24+15 months (p=0.03). Other characteristics are summarized in table 1. After diagnosis UTIs occurred in 10/52 aVUR patients (20%) vs. 39/119 (32%) UTI-VUR patients (p=0.09). Median time to UTI was 13 (IQR 33) vs. 8 (IQR 13) months for aVUR and UTI-VUR groups (p=0.10), respectively (Figure 1). Rates of surgery were 6% vs. 17% (p=0.03) and median time from presentation to surgery was 17 (IQR 30) vs. 15 (IQR 15) months, respectively (p<0.64)
Conclusion
Our results confirm that infants with aVUR are mostly males (64%) with high grade disease (62%). We have not observed the previously reported overwhelming prevalence of male gender (75%) in this population, which might have been the result of adopting a more selective approach for performing VCUGs in infants with P-HN. aVUR patients
may benefit from CAP in the first year of life as they developed similar UTI rates as children with postnatal presentation.
Table 1
| aVUR group n=52 (%) | UTI-VUR group n=119 (%) | p value | |
| Median age (mos) | 2.5 (IQR 4) | 5 (IQR 7) | <0.01 |
| Gender - Male - Female | 34 (64) 18 (36) | 51 (43) 68 (57) | <0.01 |
| Circumcision Status - Yes - No | 16 (47) 18 (53) | 11 (22) 40 (78) | 0.02 |
| CAP | 51 (98) | 108 (91) | 0.12 |
| Mean age of CAP discontinuation (mos) | 19+11 | 24+15 | 0.03 |
| VUR Grade - Low - High | 16 (38) 36 (62) | 57 (60) 62 (40) | 0.04 |
| VUR Grade - Non-Dilating - Dilating | 6 (12) 46 (88) | 17 (14) 102 (86) | 0.80 |
| Type of VUR - Active - Passive | 29 (56) 23 (44) | 60 (50) 59 (50) | 0.48 |
| HN grade - None - Low - High | 5 (38) 12 (20) 35 (42) | 65 (74) 39 (20) 15 (6) | <0.01 |
| Ureteric Dilatation | 21 (40) | 19 (16) | <0.01 |
| UTI Rate | 10 (20) | 39 (32) | 0.09 |
| Median Time to UTI (mos) | 13 (IQR 33) | 8 (IQR 13) | 0.36 |
| Surgery | 3 (6) | 22 (18) | 0.03 |
| Median time to surgery | 17 (IQR 30) | 15 (IQR 15) | 0.64 |
| Mean follow-up time | 28+26 | 36+27 | 0.07 |
Figure 1: Time to UTI
Back to 2016 Fall Congress