
PARENCHYMA TO HYDRONEPHROSIS AREA RATIO (PHAR) IS A PROMISING OUTCOME MEASURE TO QUANTIFY UPPER TRACT CHANGES IN INFANTS WITH HIGH-GRADE ANTENATAL HYDRONEPHROSIS
Mandy Rickard, MN-NP1, Armando J. Lorenzo, MD2, Caroline Munoz, BSc Student3, Luis H. Braga, MD4.
1McMaster Children's Hospital, Hamilton, ON, Canada, 2University of Toronto/ The Hospital for Sick Children, Toronto, ON, Canada, 3Clinical Urology Research Enterprise (CURE) Program, McMaster Children's Hospital, Hamilton, ON, Canada, 4McMaster University, Hamilton, ON, Canada.
Background
Infants with Society for Fetal Urology (SFU) grade III and IV hydronephrosis are closely monitored with serial ultrasounds (US) to detect trends over time and response to surgical intervention. Currently, outcome measures rely on subjective grading systems (SFU and urinary tract dilation [UTD]), or on single estimate of renal pelvis separation (antero-posterior pelvis diameter [APd]). A quantitative, aggregate measure, concurrently reflecting changes in parenchyma and degree of hydronephrosis may generate an objective, simple and standardized way to report outcomes. Herein we explore the value of renal parenchyma-to-hydronephrosis area ratio (PHAR) for this purpose.
Methods
Initial and follow-up sagittal renal ultrasound images of patients prospectively entered into a prenatal hydronephrosis database between January 2008 and January 2016, with baseline SFU grades III and IV PHN and without vesicoureteral reflux, were evaluated using NIH-sponsored image-processing software. Renal parenchyma area (RPA), hydronephrosis area (HA), PHAR, APd, and SFU grade were captured at baseline and most recent visit. Data were analyzed based on the interim need for surgical intervention to address obstruction. Means were compared with independent and paired parametric and non-parametric test, based on data distribution.
Results
Out of 196 infants (162 male; 138 left side), 58 (30%) underwent surgery. Surgical patients compared to those managed conservatively had worse baseline hydronephrosis severity markers: SFU grade (3.6+/-0.5 vs. 3.1+/-0.4; p<0.001), UTD classification (2.7+/-0.5 vs. 2.2+/-0.4; p<0.001), APd (20.3+/-10.1 vs. 12.8+/-8.0; p<0.001), HA (10.0+/-6.6 vs. 4.7+/-2.8; p<0.001), and PHAR (1.3+/-1.0 vs 3.0+/-2.9; p<0.001); but similar RPA (9.4+/-3.5 vs. 9.7+/-2.8; p=0.5). After a respective mean follow up of 34 and 26 months (p=0.01), these discrepancies persisted [SFU grade (2.3+/-1.0 vs. 1.7+/-1.0; p<0.001), UTD classification (1.5+/-0.7 vs. 1.0+/-0.7; p<0.001), APd (11.7+/-8.0 vs. 7.7+/-5.7; p<0.001), HA (6.4+/-5.1 vs. 3.6+/-2.7; p<0.001)], except for PHAR, which equalized for both groups (7.2+/-14.0 vs 7.1+/-6.1; p=0.9; Figure 1).
Conclusions
By concurrently taking into account changes in renal parenchyma and degree of hydronephrosis, PHAR appears to be a promising parameter that reflects similarities between conservative and surgical management patients despite initial discrepancies. Our data suggests that this variable may provide reassurance and a more objective assessment of improvement after surgery compared to traditional US outcome measures. 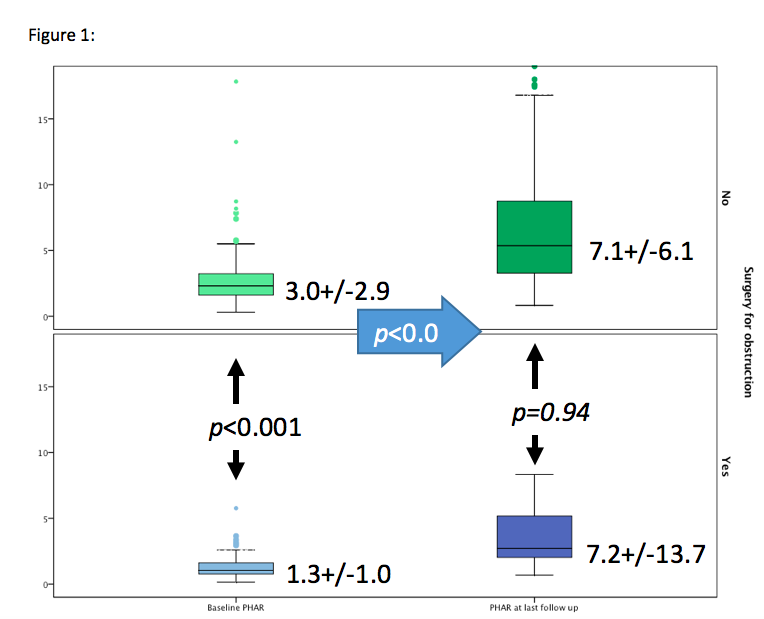
Back to 2016 Fall Congress