
The association of postnatal urinary tract dilation (UTD) risk score with clinical outcomes and surgical intervention
Caleb P. Nelson, MD, MPH1, Richard S. Lee, MD1, Andrew Trout, MD2, Sabah Servaes, MD3, Kate Kraft, MD4, Carol Barnewolt, MD1, Tanya Logvinenko, PhD1, Jeanne S. Chow, MD1.
1Boston Children's Hospital, Boston, MA, USA, 2Cincinnati Children's Hospital, Cincinnati, OH, USA, 3Children's Hospital of Philadelphia, Philadelphis, PA, USA, 4University of Michigan CS Mott, Ann Arbor, MI, USA.
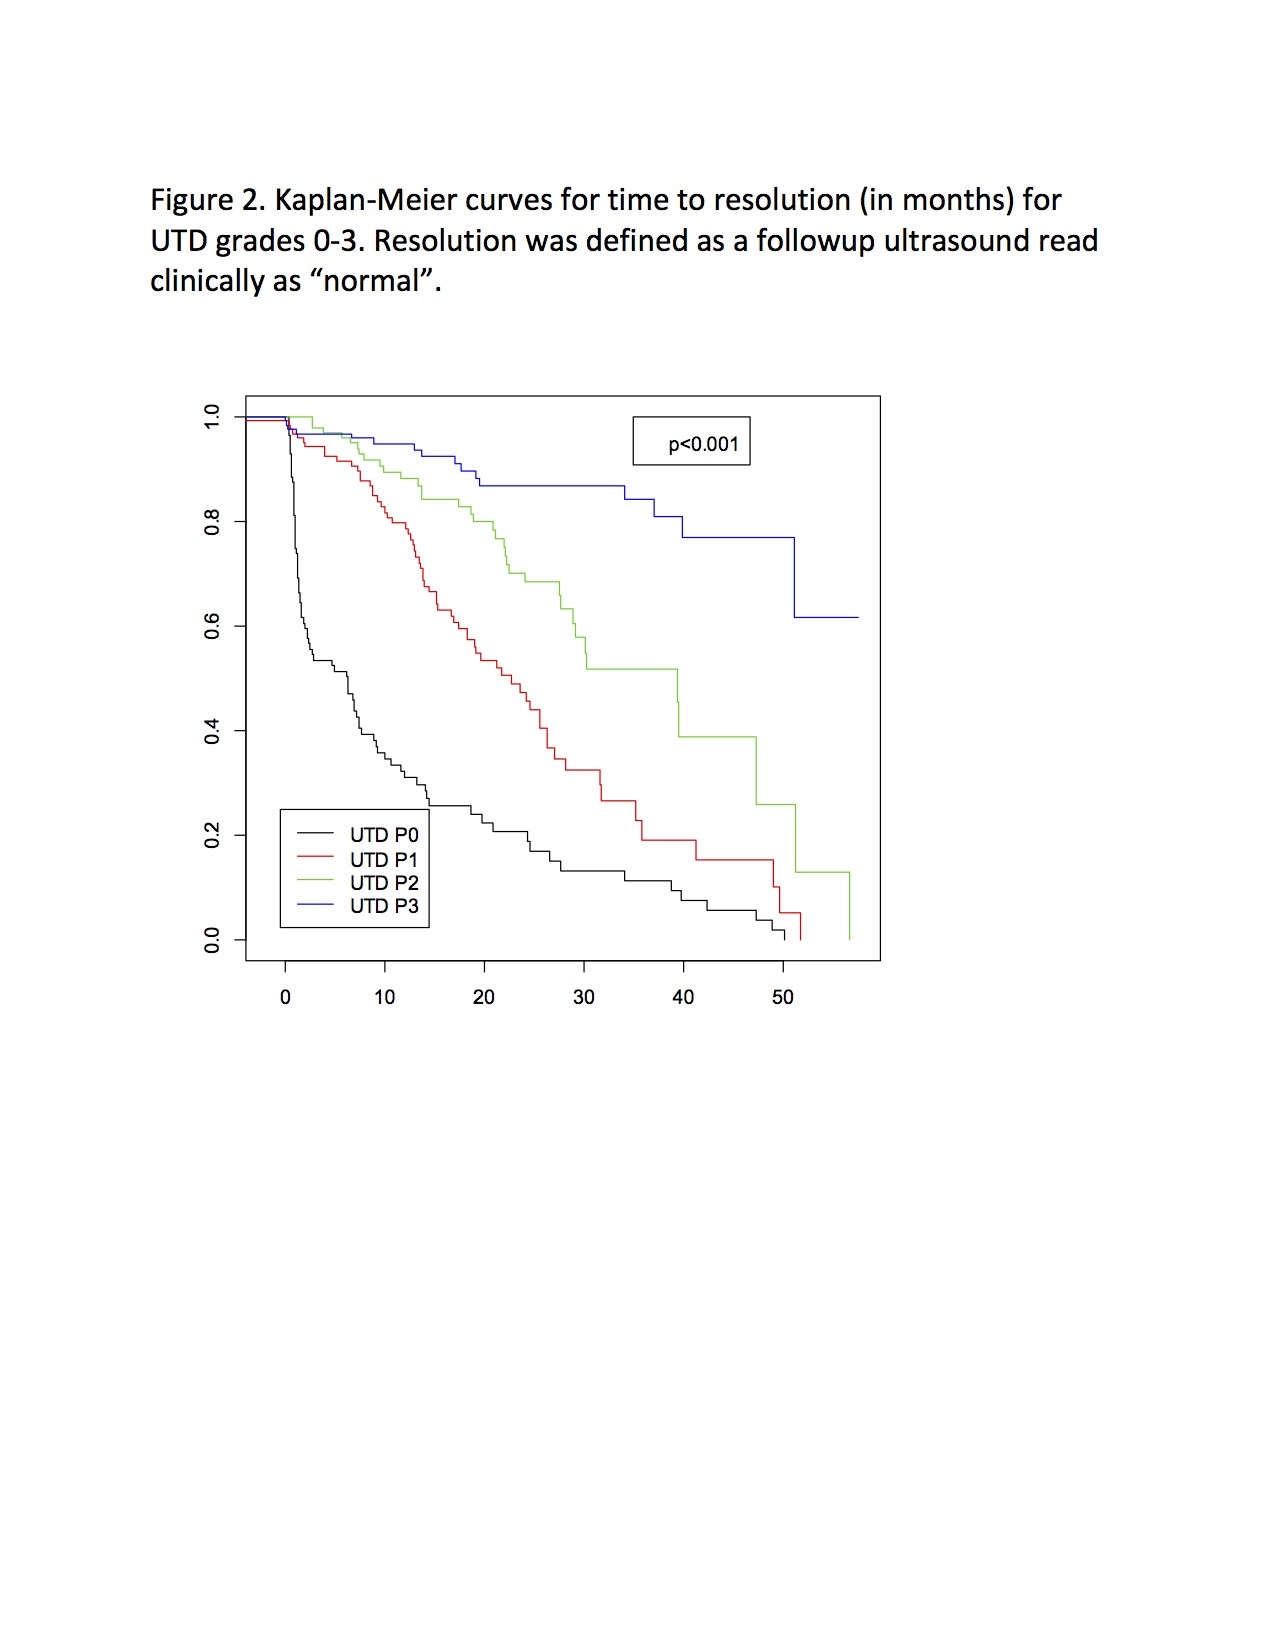
BACKGROUND: The UTD system for grading hydronephrosis was designed to be objective and comprehensive, incorporating ureteral and bladder findings. We sought to correlate postnatal UTD risk score with clinical outcomes during childhood. METHODS: Radiology records were reviewed (2012-2014) to identify patients age 0-90 days undergoing initial ultrasound for hydronephrosis history. From this group we randomly selected 500 subjects. Complete ultrasound image sets were reviewed by 1 pediatric urologist and 1 pediatric radiologist, with differences adjudicated in person. Medical records were reviewed to identify clinical events including UTI, vesicoureteral reflux (VUR), ureteropelvic junction obstruction (UPJO), ureterovesical junction obstruction (UVJO), ureterocele, bladder outlet obstruction (BOO), chronic kidney disease (CKD), surgical intervention, and resolution. UTD risk score was analyzed for association with a composite outcome comprised of UTI, anatomic diagnosis, or CKD (see Figure 1). Surgical intervention and resolution of UTD were evaluated separately. Descriptive and survival analyses were performed. RESULTS: UTD scores for 494 subjects were P0 in 23.5%, P1 in 26.5%, P2 in 23.5%, P3 in 26.5%. 74% were male. Median age at initial imaging was 28 days, median followup 19.8 months. The composite outcome occurred in 138/494 patients (27.9%) and varied significantly (p<0.001) by UTD score: 11.2% for P0, 10.7% for P1, 29.3% for P2, and 58.8% for P3 (Figure 1). UTI occurred in 6.9% of P0, 6.1% of P1, 12.1% of P2, and 16% of P3 (p=.03); 43% were on continuous antibiotic prophylaxis for a median of 85 days. Any VUR was diagnosed in 16% of patients, and was significantly less common among P0 (5.2) and P1 (9.2%) vs. P2 (19%) and P3 (28.2%) (p<.001). However, VCUG use varied strongly by UTD group (All: 56.7%, P0: 18%, P1: 44%, P2: 71%, P3: 91%, p<0.001), and among those who had a VCUG, the incidence of any VUR was 27.5%, and did not differ between UTD groups (p=0.542). UPJ obstruction was diagnosed in 6.3% of patients, 84% of whom were P3; only 2 P0/P1 patients had Mag3 performed, however. UVJ obstruction was diagnosed in just 38 patients, 28 of whom (74%) were P3. Ureterocele and BOO were diagnosed in just 7 and 3 patients respectively. Surgical intervention was also associated with UTD risk, with 46% of P3 undergoing surgery vs. 1% of P0, 1% of P1, and 6% of P2 (p<0.001). Resolution of UTD occurred in 41% (median 10.1 months) and varied significantly by UTD risk (Figure 2). CONCLUSIONS: Higher UTD risk scores correlate strongly with genitourinary diagnoses during the first two years of life, although significant ascertainment bias drives some of the difference. There is no significant difference in outcomes between P0 and P1, suggesting that the P1 category could be eliminated and these patients classified with the normal group. 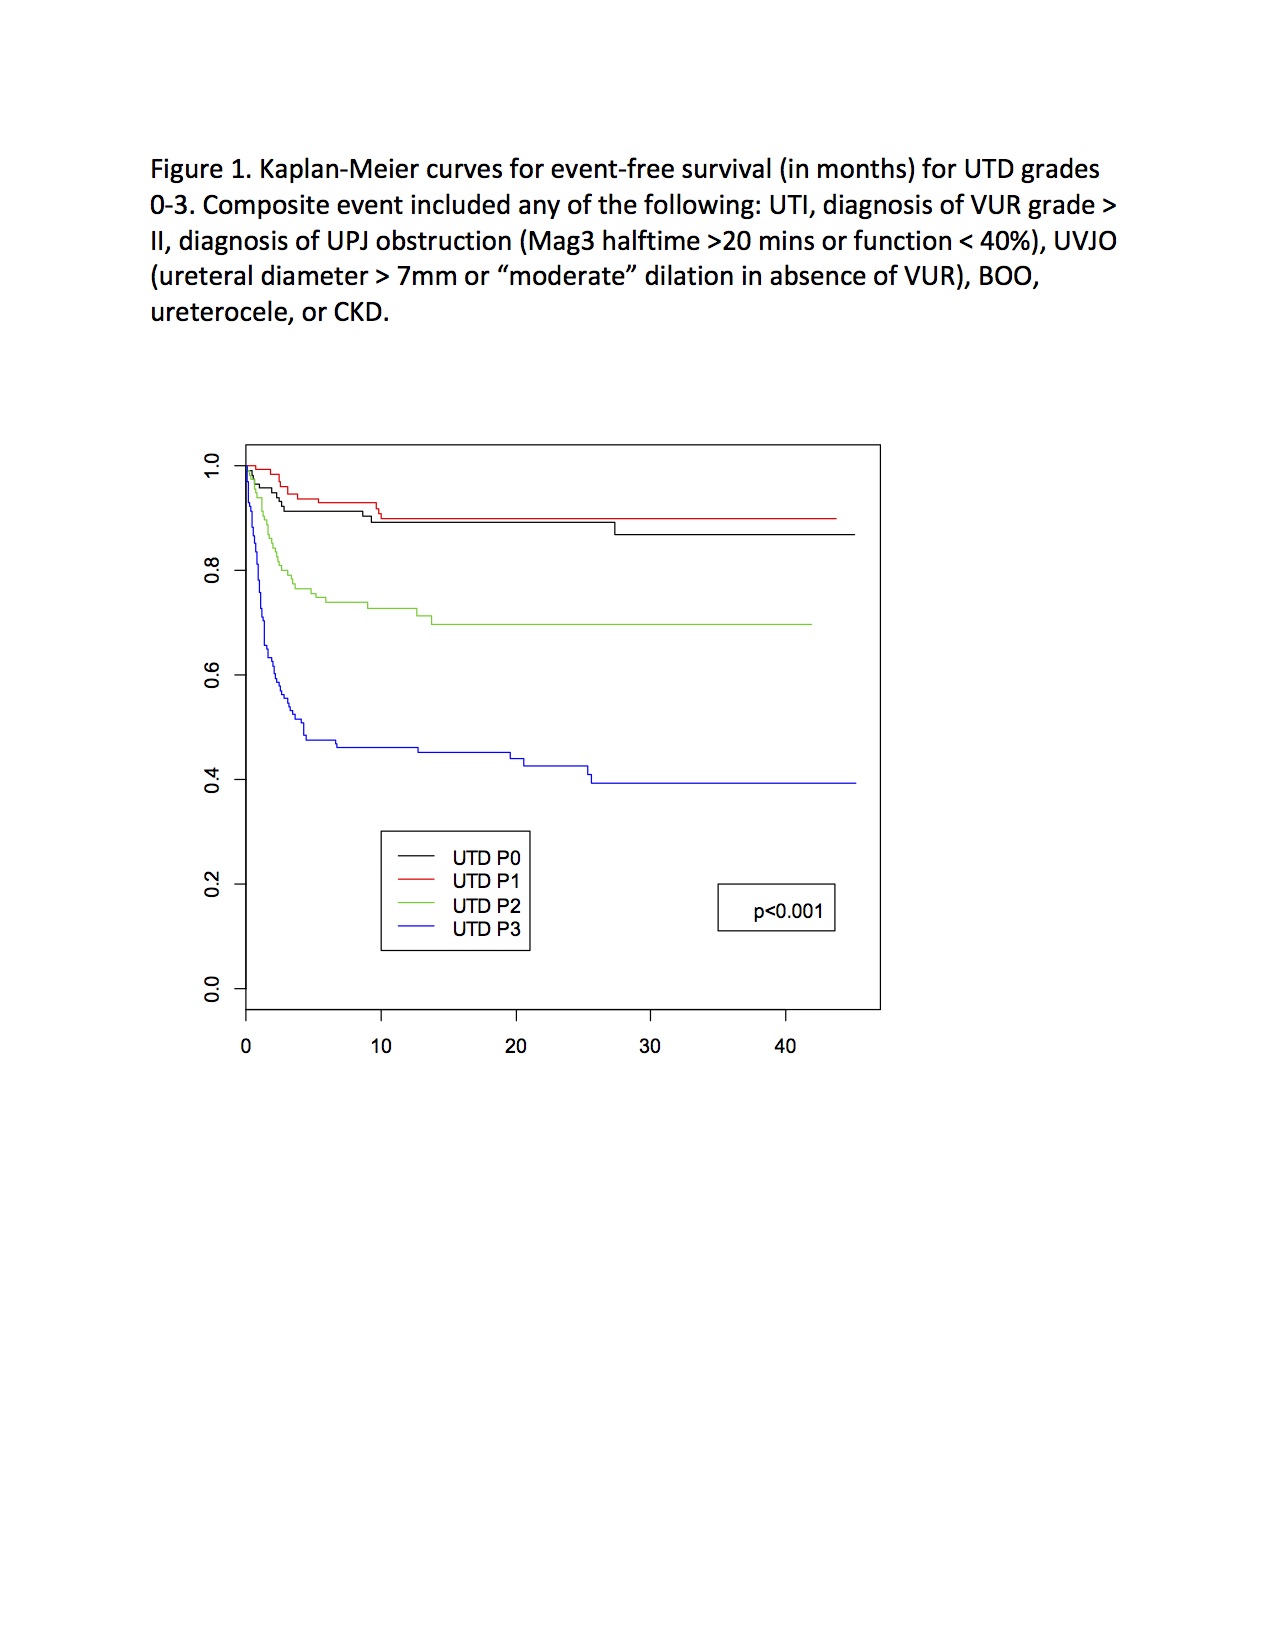
Back to 2018 Program


