
New uroflowmetry predictive formulas for adolescent males 12-20 years of age
Israel Franco, MD, Jose Murillo Netto, MD, Ph.D.
Yale University, New Haven, CT, USA.
INTRODUCTION AND OBJECTIVES:
Uroflowmetry is an important tool in evaluating patients with lower urinary tract symptoms. Unfortunately, it relies on subjective interpretation that has been shown to have a great intra- and inter-observer variation in defining the shape of curves. We have previously demonstrated a good correlation between the calculated flow index (FI) and the shape of a flow curve in children aged 4-10 years of age using a large population of supposed normal voiders. The aim of this study is to develop age appropriate formulas in adolescents to calculate average and maximal flow rates in ideal voiders.
METHODS:
We identified all males who were >12 and <20 yo and all flows that were in 1st SD of the original Liverpool nomograms. Of 754 male and uroflows, 44 males were found to be ideal voiders. An ideal voider is considered to have the following characteristics: a smooth bell shaped curve within the 1 SD parameters used to define a bell curve based on flow indexes, post voided residual (PVR) less than 20 ml, voided volume greater than 50 ml, and no pelvic floor EMG activity during voiding and lagtimes ≦ 6. All studies were reviewed by 2 experienced pediatric urologist. A nonlinear regression was done including data on maximum flow (Qmax), Average flow (Qavg), time to Qmax (TQmax), voiding time (VT) and total bladder capacity (TBC) to create a new formula to develop a new reproducible and reliable means to estimate flows in adolescent without the use of a flow nomogram. Bland Altman analysis was performed to evaluate Bias.
RESULTS:
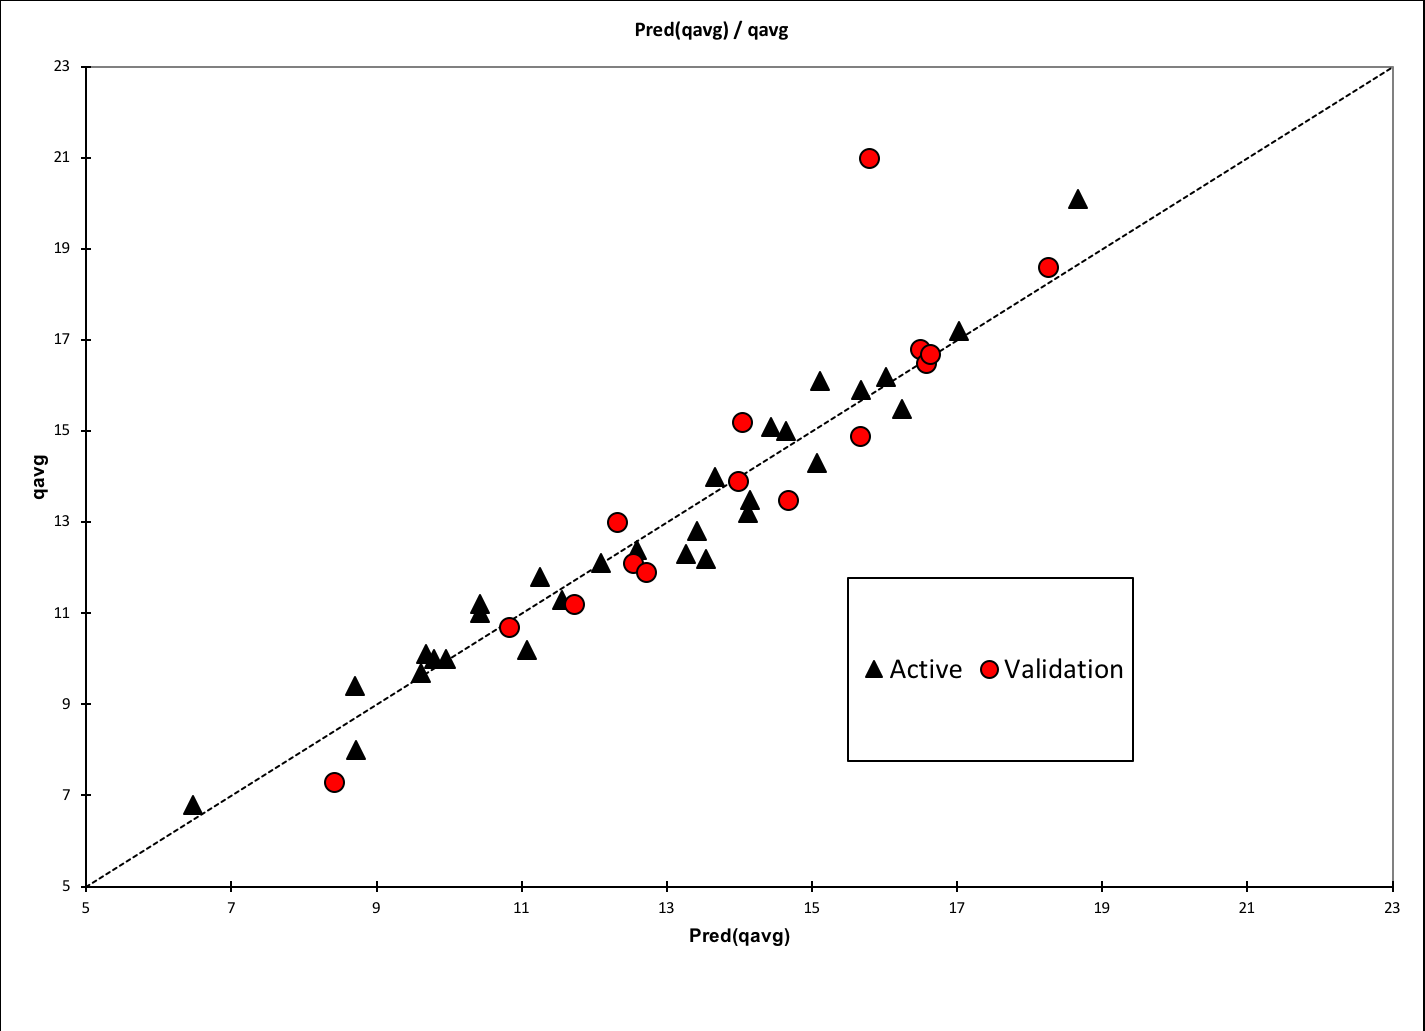
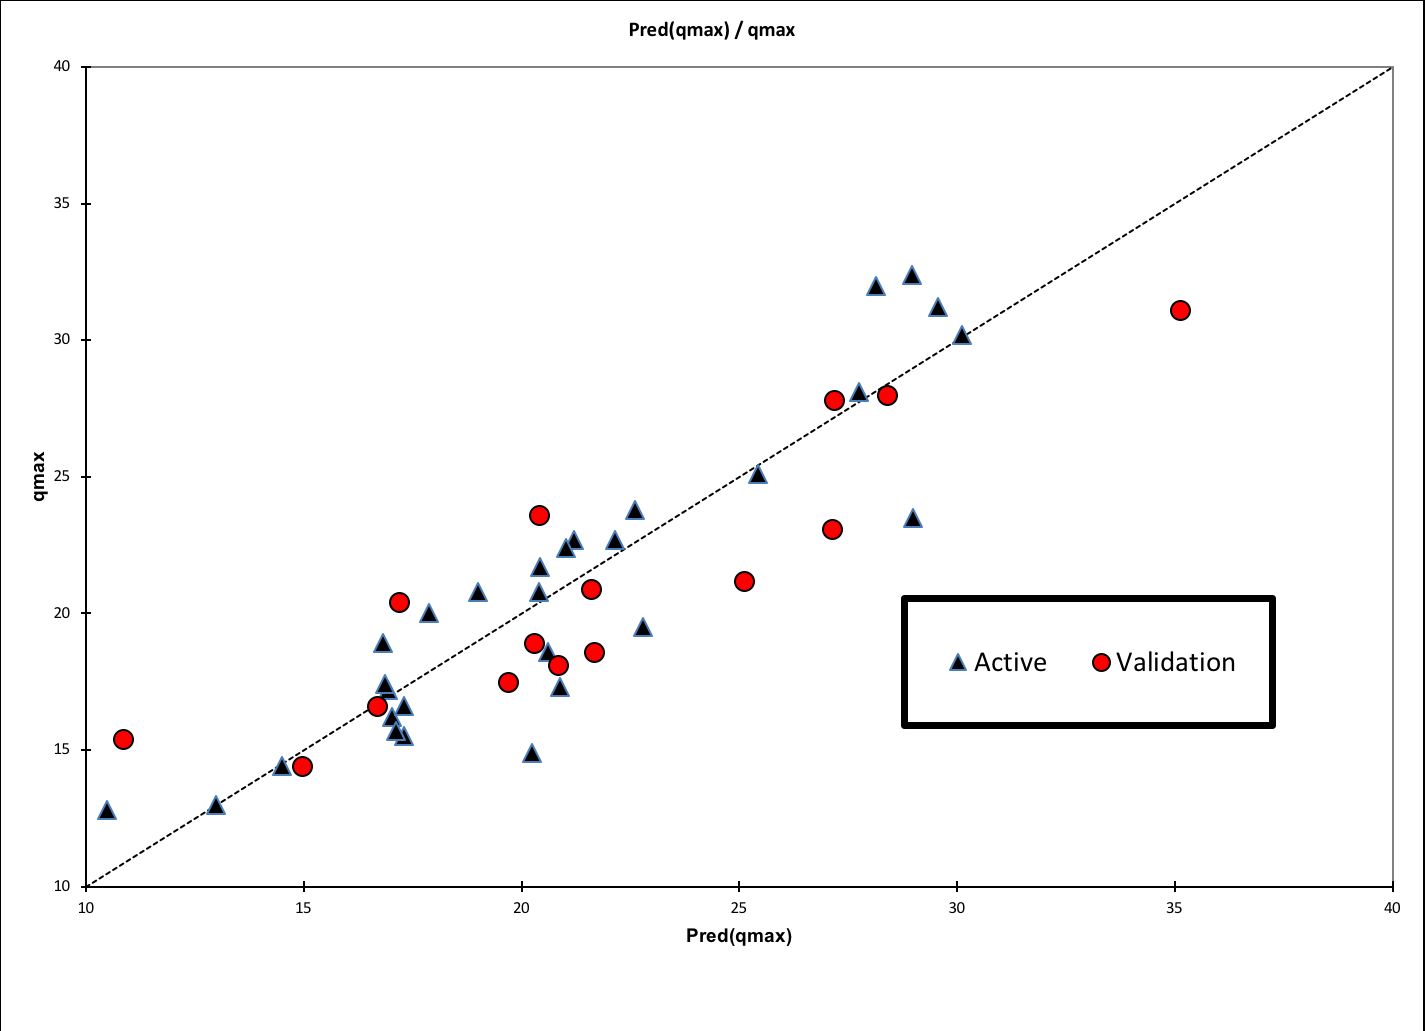
The descriptive statistics are presented in table 1. Qmax and Qavg were determined with a nonlinear regression analysis. Multiple options were examined, the best outcomes are reported: Est.Qmax (R2 = 0.835) = 15.49 - 0.58TQmax - 2.16VT + 0.19TBC + 0.0266TQmax2 + 0.05VT2 - 0.0002TBC2 Est Qavg (R2 = 0.948) = 14.87 - 2.28 VT + 0.14TBC + 0.051VT2 - 0.00018TBC. When data was compared between the teaching and learning set the %bias was 2.2% for q max and -0.09% for Q avg with t test values >0.05 for both.
| Male descriptive statistics (N=44) | ||||||||||
| Statistic | Age | qmax | qavg | Time to qmax | Flow At 2secs | accel | voidedvol | pvr | voidingtime | tbc |
| Minimum | 12.0 | 12.8 | 6.8 | 1.8 | 1.9 | 1.4 | 51.8 | 0.0 | 5.0 | 54.8 |
| Maximum | 20.0 | 32.4 | 21.0 | 11.1 | 26.5 | 11.8 | 441.1 | 19.0 | 21.4 | 441.1 |
| 1st Quartile | 13.0 | 17.1 | 11.2 | 4.5 | 9.5 | 2.6 | 125.7 | 1.0 | 10.0 | 131.9 |
| Median | 14.0 | 20.2 | 12.9 | 5.5 | 12.2 | 3.3 | 150.6 | 6.0 | 11.7 | 159.7 |
| 3rd Quartile | 17.0 | 23.5 | 15.3 | 7.1 | 16.2 | 4.5 | 207.5 | 13.0 | 14.9 | 213.4 |
| Mean | 14.9 | 20.9 | 13.2 | 6.0 | 13.1 | 3.9 | 167.4 | 7.3 | 12.6 | 174.7 |
| Standard deviation (n-1) | 2.7 | 5.3 | 3.2 | 2.3 | 5.1 | 2.1 | 71.8 | 6.2 | 4.0 | 72.1 |
CONCLUSIONS: The use of a quantitative approach to the Interpretation of uroflowmetry is important in standardizing results between studies. It further allows the a comparison between what should be expected when the flow is compared to a normal patient. The new formula estimates Qmax and Qavg based on the 3 and 2 uroflowmetry parameters respectively, making it more reliable for interpreting uroflowmetry in adolescent males.
Back to 2019 Abstracts


