
Automated Quantitative Measurement of Bladder Compliance With a Novel Compliance Curve Algorithm to Characterize Risk of Hydronephrosis
Hsin-Hsiao Scott Wang, MD, MPH, MBAn1, Michael Li, MBAn, PhD1, Ranveer Vesdev, MD2, Anudeep Mukkamala, MD1, Stuart Bauer, MD1, Carlos Estrada, MD, MBA1.
1Boston Children's Hospital, Boston, MA, USA, 2University of Minnesota Medical School Twin Cities, Minneapolis, MN, USA.
Background: Poor bladder compliance is a well-known cause of urinary tract dilation (UTD) which may portend renal damage. However, assessments of bladder compliance in urodynamic study (UDS) are often limited to arbitrary single-point pressure/volume values. Prior attempts to capture the dynamic nature of the bladder pressure-volume relationship required subjective and manual annotations. We sought to develop a novel and objective bladder compliance curve algorithm to capture continuous pressure-volume data during cystometrogram to characterize compliance and reliably predict UTD.
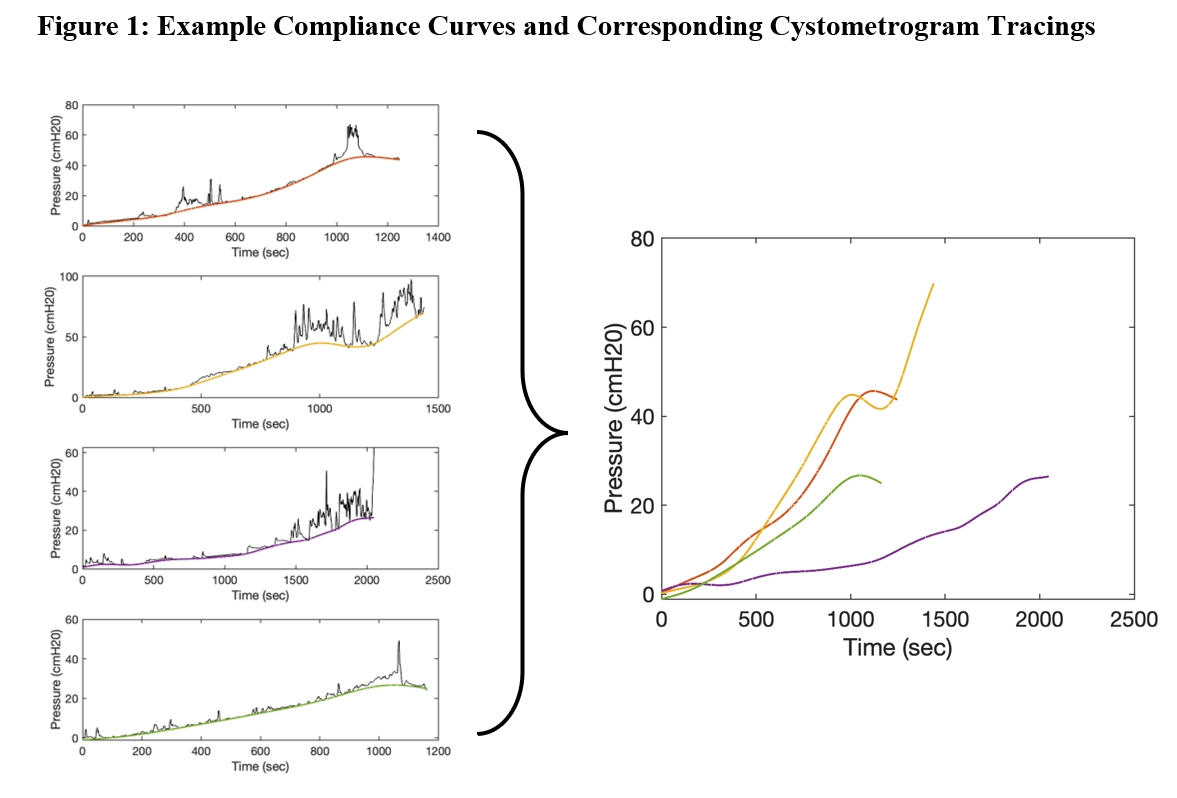
METHODS: UDS at a single instruction from 2013 to 2019 were used for algorithm development and validation. The electronic medical record was used to identify renal ultrasound (US) studies and clinical covariates including demographics, presence and grade of vesicoureteral reflux (VUR), continence, and bladder management in patients undergoing UDS. We defined the “compliance curve” by utilizing a proprietary algorithm to systematically create a noise-free curve from intravesical pressure (Figure 1). Additional measurements extracted from the compliance curve included curve tortuosity, arc length, algorithm-derived detrusor maximal pressure (PdetMax) and detrusor leak point pressure (DLPP), segmented area under the compliance curve (AUCC), and mean compliance curve pressure versus % volume.
A multivariate mixed logistic regression model adjusted for repeated patients was fitted to assess the association between UTD and clinical or urodynamic covariates. Sensitivity analyses excluding either vesicoureteral reflux (VUR) grade >2 or non-neurogenic bladder were performed.
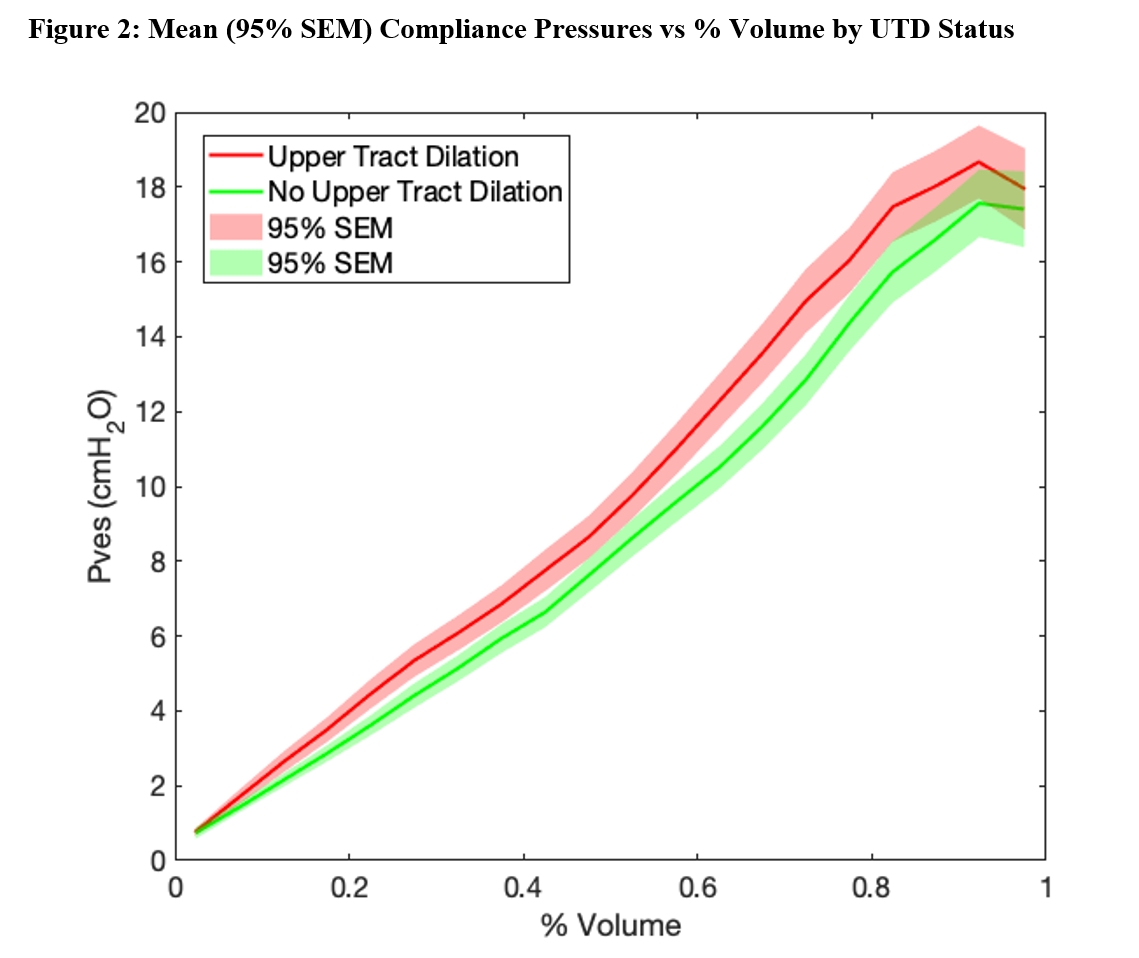
Results: 1178 UDS (864 unique patients) were included. The mean age was 10.4±7.2 years and 54% were female. UTD was found in 560 UDS. Compared to those without UTD, mean compliance pressures were significantly higher for patients with UTD (p<0.05, Figure 2).
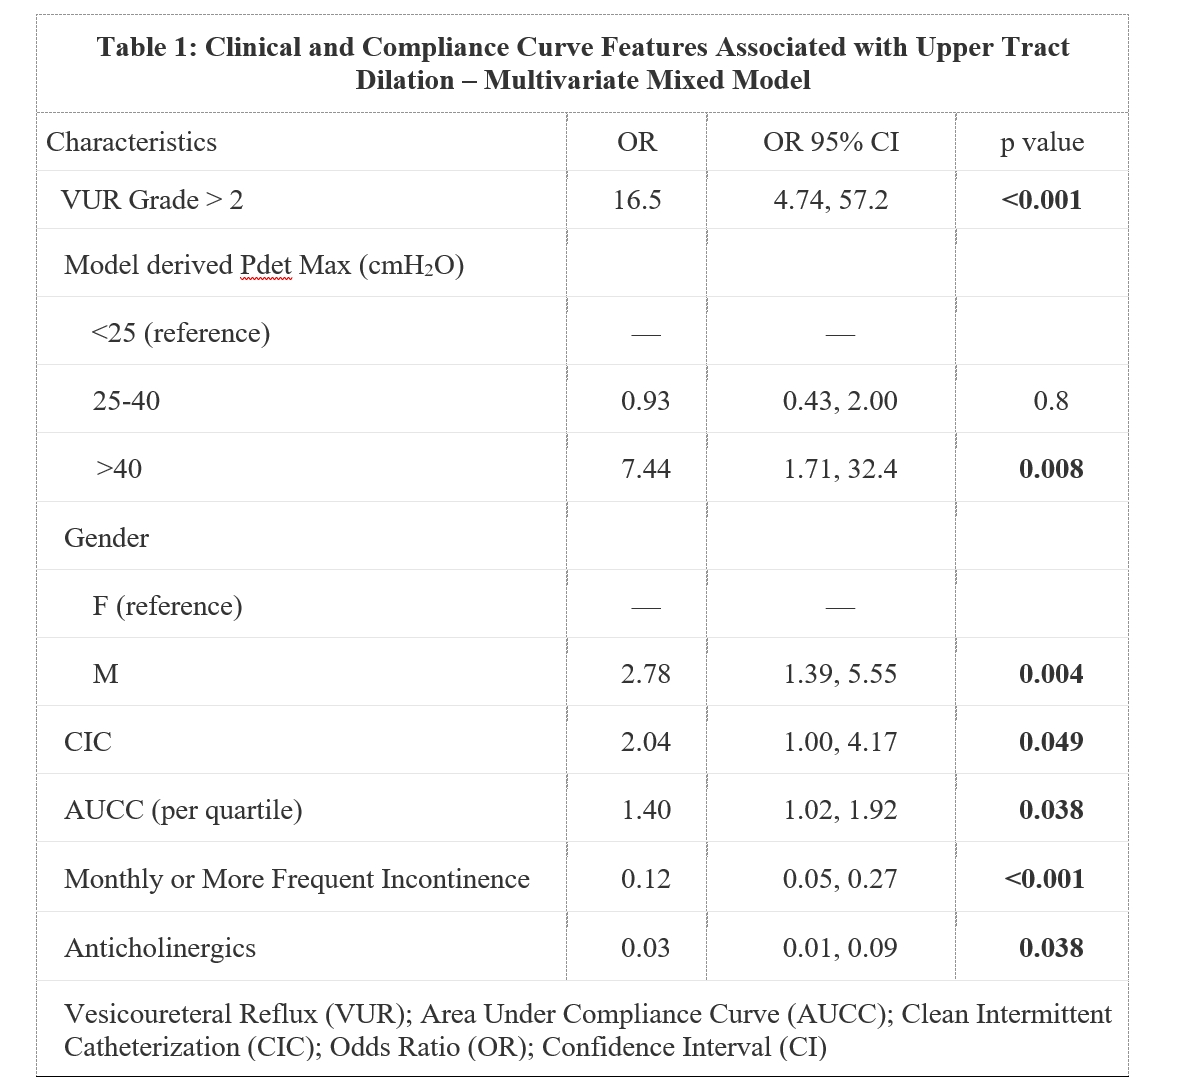
In the multivariate model (Table 1), algorithm-derived DLPP/PdetMax over 40 cmH2O (OR=7.44[95CI=1.71-32.4], p=0.008; no statistical significance for <25 vs 25-40cmH2O pressures) and higher AUCC (OR=1.40 per quartile increase,[95CI=1.02-1.92], p=0.038) were found to be significantly associated with UTD after adjusting for age, sex, VUR, incontinence, CIC, and anticholinergic use. Compared to the algorithm derived DLPP/PdetMax, the clinician derived DLPP/PdetMax values were not significantly associated with UTD on multivariate analysis.
Sensitivity analyses excluding patients with VUR grade >2 or non-neurogenic bladder demonstrated similar results.
CONCLUSIONS: Our bladder compliance curve algorithm and derived quantitative parameters are significantly associated with distinct UTD phenotypes in children. This novel algorithm demonstrates promising performance to provide an objective, reliable, and scalable solution for bladder compliance evaluations.
Back to 2023 Abstracts