
National Opioid Prescribing Rates Before And After The 2018 American Academy Of Pediatrics Statement: A Claims Database Analysis
Corey Able, BS1, Courtney Stewart, BA2, Andrew Gabrielson, MD3, Tyler Overholdt, MD4, Steven Banner, BS2, Aditya Srinivasan, MD, MPH1, Nora Haney, MD3, Taylor P. Kohn, MD, MPhil3, Jonathan Gerber, MD1.
1University of Texas Medical Branch, Department of Surgery, Division of Urology, Galveston, TX, USA, 2University of Texas Medical Branch, School of Medicine, Galveston, TX, USA, 3The James Buchanan Brady Urological Institute, Johns Hopkins University School of Medicine, Baltimore, MD, USA, 4Wake Forest University, Department of Urology, Winston Salem, NC, USA.
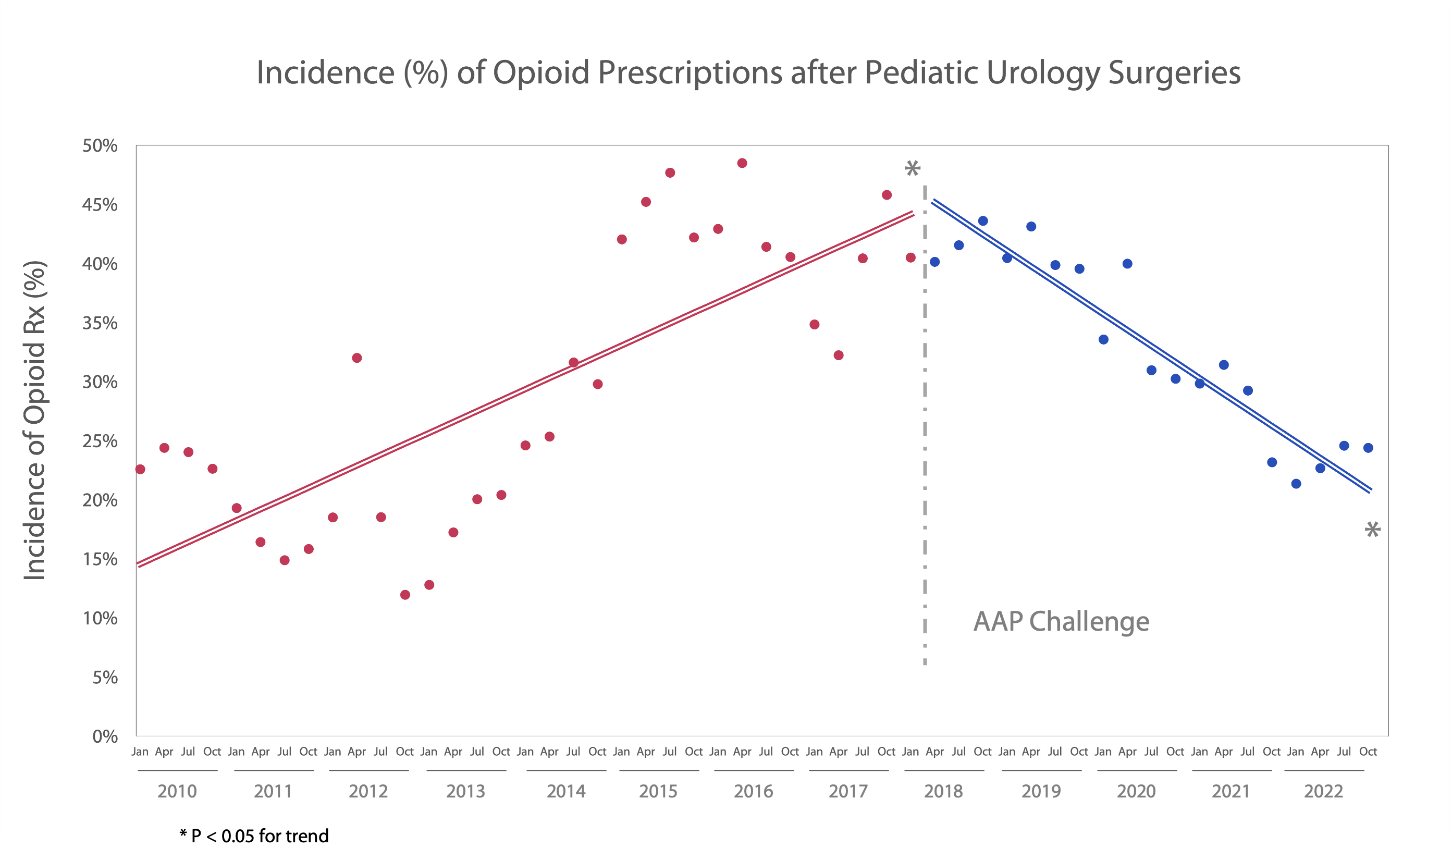
BACKGROUND: In March 2018, the American Academy of Pediatrics released a challenge to physicians to reduce opioid prescribing to pediatric patients by 50%. In this study, we evaluate the overall rates and trends of pediatric opioid prescriptions.
METHODS: We queried the TriNetX Research database and included children under age 18 who underwent circumcision, hydrocelectomy, inguinal hernia repair, orchiopexy, hypospadias repair, pyeloplasty, or ureteral reimplantation who received an oral opioid prescription within five days of surgery. Patients were excluded if they received any concomitant surgery. The primary analysis evaluated the total rate of opioid prescriptions (number of patients prescribed opioids/number of procedures) using 3 month intervals from January 2010 to December 2022. Secondary analysis was performed by procedures, race (White, Black, Hispanic), age (0 to 5, 6 to 10, 11 to 18), and United States geographic region (West, Midwest, South, Northeast). We performed an interrupted time series analysis assessing trends prior to the challenge, immediate difference, and trends after the challenge. Linear regression for the interrupted time series was performed with statistical significance set at p<0.05. RESULTS: A total of 77823 pediatric cases were identified, 25617 (32.92%) of which received an opioid prescription. Table 1 displays the rate of pediatric urology opioid prescriptions over time. We found that opioids were on average prescribed at a rate of 29.8% of circumcisions, 39.6% of hypospadias repairs, 25.8% of hydrocelectomies, 42.7% of pyeloplasties, and 42.8% of ureteral reimplants. An opioid prescription was received by 30.6% of patients ages 0 to 5, 34.3% of patients age 6 to 10, and 33.7% of patients ages 11 to 18. An opioid prescription was received by 36.7% of White patients, 28.7% of Black or African American patients, and 36.4% of Hispanic or Latino patients. An opioid prescription was received by 39.4% of patients in the West, 56.9% in the Midwest, 38.7% in the South, and 24.4% in the Northeast. In all cases, there was a significantly positive trend prior to the challenge and a significantly negative trend after.
CONCLUSIONS: We conclude that prescription rates remain high but have steadily decreased since the AAP statement. Additionally, the racial and age prescription disparities warrant further evaluation.
Back to 2023 Abstracts